Glossary
Glossary
Administrative data
Administrative data is the term used to describe everyday data about individuals collected by government departments and agencies. Examples include exam results, benefit receipt and National Insurance payments.
Age effects
Age effects relates to changes in an outcome as a result of getting older.
Anonymisation
Anonymisation refers to the removal of study participants' identifying information (e.g., name, address) in order to preserve their privacy.
Attrition
Attrition is the discontinued participation of study participants in a longitudinal study. Attrition can reflect a range of factors, from the study participant not being traceable to them choosing not to take part when contacted. Attrition is problematic both because it can lead to bias in the study findings (if the attrition is higher among some groups than others) and because it reduces the size of the sample.
Baseline
Baseline refers to the start of a study when initial information is collected on participation (however, in longitudinal studies, researchers may adopt an alternative ‘baseline’ for the purposes of analysis).
Biological samples
Biological samples is the term used for specimens collected from human subjects from which biological information, such as genetic markers, can be extracted for analysis. Common examples include blood, saliva or hair.
Body mass index
Body mass index is a measure used to assess if an individual is a healthy weight for their height. It is calculated by dividing the individual’s weight by the square of their height, and it is typically represented in units of kg/m2.
Boosted samples
Boosted samples are used to overcome sample bias due to attrition or to supplement the representation of smaller sub-groups within the sample. Inclusion of boosted samples must be accompanied by appropriate survey weights.
CAPI
Computer-assisted personal interviewing (CAPI) is a technique for collecting data from participants using computers to eliminate common errors such as questionnaire routing and data entry mistakes. The use of computers take place within the context of a face-to-face interview.
CASI
Computer-assisted self-interviewing (CASI) is a technique for collecting data from participants using computers to eliminate common errors such as questionnaire routing and data entry mistakes. The use of computers take place within the context of a self-completion questionnaire.
Categorical variable
A categorical variable is a variable that can take one of a limited number of discrete values. They can be either nominal - they contain no inherent order of categories (e.g. sex; marital status) - or ordinal - they can be ranked in some meaningful order (e.g. level of satisfaction with a service).
CATI
Computer-assisted telephone interviewing (CATI) is a technique for collecting data from participants using computers to eliminate common errors such as questionnaire routing and data entry mistakes. The use of computers take place within the context of a telephone interview.
Censoring
For some study participants the exact time of an event will not be known because either: the study ends (or the analysis is carried out) before they have had the event, or the participant drops out of the study before experiencing the event. It is therefore, only known that the event has not occurred up to the time that they were last observed in the study.
Census
Census refers to a universal and systematic collection of data from all individuals within a population. In the UK, the government conducts a census every ten years with the next one due in 2021.
Codebook
A codebook is a document (online or hard-copy) that contains all the information about how a dataset has been coded, such that it can be deciphered by a researcher not familiar with the original coding frame.
Coding
Coding is the process of converting survey responses into numerical codes to facilitate data analysis. All potential responses (as well as possible reasons for non-response) for each variable are assigned numerical values according to a coding frame.
Cognitive assessments
Cognitive assessments are exercises used to measure thinking abilities, such as memory, reasoning and language. Longitudinal studies collecting data in this way can track the extent to which someone's cognitive abilities change (develop or decline) over time.
Cohort studies
Cohort studies are concerned with charting the lives of groups of individuals who experience the same life events within a given time period. The best known examples are birth cohort studies, which follow a group of people born in a particular period.
Complete case analysis
Complete case analysis is the term used to describe a statistical analysis that only includes participants for which we have no missing data on the variables of interest. Participants with any missing data are excluded.
Conditioning
Conditioning refers to the process whereby participants' answers to some questions may be influenced by their participation in the study – in other words, their responses are 'conditioned' by their being members of a longitudinal study. Examples would include study respondents answering questions differently or even behaving differently as a result of their participation in the study.
Confounding
Confounding occurs where the relationship between independent and dependent variables is distorted by one or more additional, and sometimes unmeasured, variables. A confounding variable must be associated with both the independent and dependent variables but must not be an intermediate step in the relationship between the two (i.e. not on the causal pathway).
For example, we know that physical exercise (an independent variable) can reduce a person’s risk of cardiovascular disease (a dependent variable). We can say that age is a confounder of that relationship as it is associated with, but not caused by, physical activity and is also associated with coronary health. See also ‘unobserved heterogeneity’, below.
Continuous variable
A continuous variable is a variable that has an infinite number of uncountable values e.g. time, temperature. They are also known as quantitative variables or scale variables.
Cohort effects
Cohort effects relates to changes in an outcome associated with being a member of a specific cohort of people (e.g. born in the same year; or starting school at the same time).
Coverage
In metadata management, coverage refers to the temporal, spatial and topical aspects of the data collection to describe the comprehensiveness of a dataset. For longitudinal studies, this can relate to the topics that are covered across waves, the population to which one can generalise or the geographic extent of the dataset.
Cross-sectional
Cross-sectional surveys involve interviewing a fresh sample of people each time they are carried out. Some cross-sectional studies are repeated regularly and can include a large number of repeat questions (questions asked on each survey round).
Data access agreement
Within the context of data protection, a data access agreement specifies the terms under which users are provided access to specified datasets. This usually forms part of the application process to the data controller to ensure that researchers adhere to a set of terms regarding data confidentiality, sensitivity and dissemination before accessing the data. See also: research ethics
Data cleaning
Data cleaning is an important preliminary step in the data analysis process and involves preparing a dataset so that it can be correctly analysed. 'Cleaning' the data usually involves identifying data input errors, assessing the completeness of the dataset and verifying any anomalies (e.g. outliers).
Data confidentiality
Within the context of data protection, data confidentiality is the process of protecting participants' data from being accessed or disclosed by those unauthorised to do so. Key methods employed in data confidentiality include anonymisation of responses (removal of personal identifying information) and data encryption (protecting the data using codes and/or passwords).
Data harmonisation
Data harmonisation involves retrospectively adjusting data collected by different surveys to make it possible to compare the data that was collected. This enables researchers to make comparisons both within and across studies. Repeating the same longitudinal analysis across a number of studies allows researchers to test whether results are consistent across studies, or differ in response to changing social conditions.
Data imputation
Data imputation is a technique for replacing missing data with an alternative estimate. There are a number of different approaches, including mean substitution and model-based multivariate approaches.
Data linkage
Data linkage simply means connecting two or more sources of administrative, educational, geographic, health or survey data relating to the same individual for research and statistical purposes. For example, linking housing or income data to exam results data could be used to investigate the impact of socioeconomic factors on educational outcomes.
Data protection
Data protection refers to the broad suite of rules governing the handling and access of information about people. Data protection principles include confidentiality of responses, informed consent of participants and security of data access. These principles are legally protected by the Data Protection Act (DPA) and the General Data Protection Regulation (GDPR).
Data structure
Data structure refers to the way in which data are organised and formatting in advance of data analysis.
Dependent variable
In analysis, the dependent variable is the variable you expect to change in response to different values of your independent (or predictor) variables. For example, a students’ test results may be (partially) explained by the number of hours spent on revision. In this case, the dependent variable is students’ test score, which you expect to be different according to the amount of time spent revising.
Derived variable
A derived variable is a variable that is calculated from the values of other variables and not asked directly of the participants. It can involve a mathematical calculation (e.g. deriving monthly income from annual income by dividing by 12) or a recategorisation of one or more existing variables (e.g. categorising monthly income into £500 bands - £0 to £500, £501 to £1,000, etc.)
Diaries
Diaries are a data collection instrument that is particularly useful in recording information about time use or other regular activity, such as food intake. They have the benefit of collecting data from participants as and when an activity occurs. As such, they can minimise recall bias and provide a more accurate record of activities than a retrospective interview.
Dissemination
Dissemination is the process of sharing information – particularly research findings – to other researchers, stakeholders, policy makers, and practitioners through various avenues and channels, including online, written publications and events. Dissemination is a planned process that involves consideration of target audiences in ways that will facilitate research uptake in decision-making processes and practice.
Dummy variables
Dummy variables, also called indicator variables, are sets of dichotomous (two-category) variables we create to enable subgroup comparisons when we are analysing a categorical variable with three or more categories.
Empirical data
Empirical data refers to data collected through observation or experimentation. Analysis of empirical data can provide evidence for how a theory or assumption works in practice.
Fields
In metadata management, fields are the elements of a database which describes the attributes of items of data.
General ability
General ability is a term used to describe cognitive ability, and is sometimes used as a proxy for intelligent quotient (IQ) scores.
Growth curve modelling
Growth curve modelling is used to analyse trajectories of longitudinal change over time allowing us to model the way participants change over time, and then to explore what characteristics or circumstances influence these patterns of longitudinal change.
Hazard rate
Hazard rate refers to the probability that an event of interest occurs at a given time point, given that it has not occurred before.
Health assessments
Health assessments refers to the assessments carried out on research participants in relation to their physical characteristics or function. These can include measurements of height and weight, blood pressure or lung function.
Heterogeneity
Heterogeneity is a term that refers to differences, most commonly differences in characteristics between study participants or samples. It is the opposite of homogeneity, which is the term used when participants share the same characteristics. Where there are differences between study designs, this is sometimes referred to as methodological heterogeneity. Both participant or methodological differences can cause divergences between the findings of individual studies and if these are greater than chance alone, we call this statistical heterogeneity. See also: unobserved heterogeneity.
Household panel surveys
Household panel surveys collect information about the whole household at each wave of data collection, to allow individuals to be viewed in the context of their overall household. To remain representative of the population of households as a whole, studies will typically have rules governing how new entrants to the household are added to the study.
Incentives and rewards
As a way of encouraging participants to take part in research, they may be offered an incentive or a reward. These may be monetary or, more commonly, non-monetary vouchers or tokens. Incentives are advertised beforehand and can act as an aid to recruitment; rewards are a token of gratitude to the participants for giving their time.
Independent variable
In analysis, an independent variable is any factor that may be associated with an outcome or dependent variable. For example, the number of hours a student spends on revision may influence their test result. In this case, the independent variable, revision time (at least partially) 'explains' the outcome of the test.
Informed consent
A key principle of research ethics, informed consent refers to the process of providing full details of the research to participants so that they are sufficiently able to choose whether or not to consent to taking part.
Kurtosis
Kurtosis is sometimes described as a measure of ‘tailedness’. It is a characteristic of the distribution of observations on a variable and denotes the heaviness of the distribution’s tails. To put it another way, it is a measure of how thin or fat the lower and upper ends of a distribution are.
Life course
A person's life course refers to the experiences and stages an individual passes through during their life. It centres on the individual and emphasises the changing social and contextual processes that influence their life over time.
Longitudinal studies
Longitudinal studies gather data about the same individuals ('study participants') repeatedly over a period of time, in some cases from birth until old age. Many longitudinal studies focus upon individuals, but some look at whole households or organisations.
Metadata
Metadata refers to data about data, which provides the contextual information that allows you to interpret what data mean.
Missing data
Missing data refers to values that are missing and do not appear in a dataset. This may be due to item non-response, participant drop-out (or attrition) or, in longitudinal studies, some data (e.g. date of birth) may be collected only in some waves. Large amounts of missing data can be a problem and lead researchers to make erroneous inferences from their analysis. There are several ways to deal with the issue of missing data, from casewise deletion to complex multiple imputation models.
Multi-level modelling
Multi-level modelling refers to statistical techniques used to analyse data that is structured in a hierarchical or nested way. For example. study participants who belong to the same household, or students who attend the same school may be expected to be more similar to each other than to participants in other households or schools (such as sharing similar contextual influences). This similarity means that the data from participants within these households/schools are not independent. Multi-level models can account for variability at both the individual level and the group (e.g. household or school) level.
Non-response bias
Non-response bias is a type of bias introduced when those who participate in a study differ to those who do not in a way that is not random (for example, if attrition rates are particularly high among certain sub-groups). Non-random attrition over time can mean that the sample no longer remains representative of the original population being studied. Two approaches are typically adopted to deal with this type of missing data: weighting survey responses to re-balance the sample, and imputing values for the missing information.
Observational studies
Observational studies focus on observing the characteristics of a particular sample without attempting to influence any aspects of the participants’ lives. They can be contrasted with experimental studies, which apply a specific ‘treatment’ to some participants in order to understand its effect.
Panel studies
Panel studies follow the same individuals over time. They vary considerably in scope and scale. Examples include online opinion panels and short-term studies whereby people are followed up once or twice after an initial interview.
Peer review
Peer review is a method of quality control in the process of academic publishing, whereby research is appraised (usually anonymously) by one or more independent academic with expertise in the subject.
Period effects
Period effects relate to changes in an outcome associated with living during a particular time, regardless of age or cohort membership (e.g. living through times of war, economic recession or global pandemic).
Piloting
Piloting is the process of testing your research instruments and procedures to identify potential problems or issues before implementing them in the full study. A pilot study is usually conducted on a small subset of eligible participants who are encouraged to provide feedback on the length, comprehensibility and format of the process and to highlight any other potential issues.
Population
Population refers to all the people of interest to the study and to whom the findings will be able to be generalized (e.g. a study looking into rates of recidivism may have a [target] population encompassing everyone with a criminal conviction). Owing to the size of the population, a study will usually select a sample from which to make inferences. See also: sample, representiveness.
Percentiles
A percentile is a measure that allows us to explore the distribution of data on a variable. It denotes the percentage of individuals or observations that fall below a specified value on a variable. The value that splits the number of observations evenly, i.e. 50% of the observations on a variable fall below this value and 50% above, is called the 50th percentile or more commonly, the median.
Primary research
Primary research refers to original research undertaken by researchers collecting new data. It has the benefit that researchers can design the study to answer specific questions and hypotheses rather than relying on data collected for similar but not necessarily identical purposes. See also: secondary research
Prospective study
In prospective studies, individuals are followed over time and data about them is collected as their characteristics or circumstances change.
Qualitative data
Qualitative data are non-numeric - typically textual, audio or visual. Qualitative data are collected through interviews, focus groups or participant observation. Qualitative data are often analysed thematically to identify patterns of behaviour and attitudes that may be highly context-specific.
Quantitative data
Quantitative data can be counted, measured and expressed numerically. They are collected through measurement or by administering structured questionnaires. Quantitative data can be analysed using statistical techniques to test hypotheses and make inferences to a population.
Questionnaires
Questionnaires are research instruments used to elicit information from participants in a structured way. They might be administered by an interviewer (either face-to-face or over the phone), or completed by the participants on their own (either online or using a paper questionnaire. Questions can cover a wide range of topics and often include previously-validated instruments and scales (e.g. the Rosenberg Self-Esteem Scale).
Recall error or bias
Recall error or bias describes the errors that can occur when study participants are asked to recall events or experiences from the past. It can take a number of forms – participants might completely forget something happened, or misremember aspects of it, such as when it happened, how long it lasted, or other details. Certain questions are more susceptible to recall bias than others. For example, it is usually easy for a person to accurately recall the date they got married, but it is much harder to accurately recall how much they earned in a particular job, or how their mood at a particular time.
Record linkage
Record linkage studies involve linking together administrative records (for example, benefit receipts or census records) for the same individuals over time.
Reference group
A reference group is a category on a categorical variable to which we compare other values. It is a term that is commonly used in the context of regression analyses in which categorical variables are being modelled.
Regression analysis
Regression analysis refers to analytical techniques that use a mathematical 'model' to predict values of a dependent variable from values of one or many independent variable(s).
Repeated measures
Repeated measures are measurements of the same variable at multiple time points on the same participants, allowing researchers to study change over time.
Representativeness
Representativeness is the extent to which a sample is representative of the population from which it is selected. Representative samples can be achieved through, for example, random sampling, systematic sampling, stratified sampling or cluster sampling.
Research ethics
Research ethics relates to the fundamental codes of practice associated with conducting research. Ethical issues that need to be considered include providing informed consent to participants, non-disclosure of sensitive information, confidentiality and anonymity safeguarding of vulnerable groups, and respect for participants' well-being. Academic research proposals need be approved by an ethics committee before any actual research (either primary or secondary) can begin.
Research impact
Research impact is the demonstrable contribution that research makes to society and the economy that can be realised through engagement with other researchers and academics, policy makers, stakeholders and members of the general public. It includes influencing policy development, improving practice or service provision, or advancing skills and techniques.
Residuals
Residuals are the difference between your observed values (the constant and predictors in the model) and expected values (the error), i.e. the distance of the actual value from the estimated value on the regression line.
Respondent burden
Respondent burden is a catch all phrase that describes the perceived burden faced by participants as a result of their being involved in a study. It could include time spent taking part in the interview and inconvenience this may cause, as well as any difficulties faced as a result of the content of the interview.
Response rate
Response rate refers to the proportion of participants in the target sample who completed the survey. Longitudinal surveys are designed with the expectation that response rates will decline over time so will typically seek to recruit a large initial sample in order to compensate for likely attrition of participants.
Retrospective study
In retrospective studies, individuals are sampled and information is collected about their past. This might be through interviews in which participants are asked to recall important events, or by identifying relevant administrative data to fill in information on past events and circumstances.
Sample
Sample is a subset of a population that is used to represent the population as a whole. This reflects the fact that it is often not practical or necessary to survey every member of a particular population. In the case of birth cohort studies, the larger ‘population’ from which the sample is drawn comprises those born in a particular period. In the case of a household panel study like Understanding Society, the larger population from which the sample was drawn comprised all residential addresses in the UK.
Sample size
Sample size refers to the number of data units contained within a dataset. It most frequently refers to the number of respondents who took part in your study and for whom there is usable data. However, it could also relate to households, countries or other institutions. The size of a sample, relative to the size of the population, will have consequences for analysis: the larger a sample is, the smaller the margin of error of its estimates, the more reliable the results of the analysis and the greater statistical power of the study.
Sampling frame
A sampling frame is a list of the target population from which potential study participants can be selected.
Scales
Scales are frequently used as part of a research instrument seeking to measure specific concepts in a uniform and replicable way. Typically, they are composed of multiple items that are aggregated into one or more composite scores. Examples of standardised scales include the British Ability Scale (BAS); the Malaise Inventory; and the Rosenberg Self-Esteem Scale.
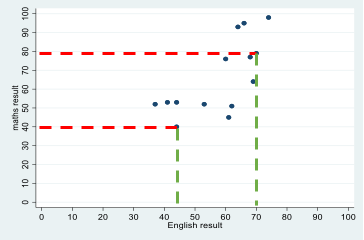
Scatterplot
A scatterplot is a way of visualising the relationship between two continuous variables by plotting the value of each associated with a single case on a set of X-Y coordinates. For example, students' test scores in English and maths can be represented as point on a graph, with each point representing a single student's English (x-axis) and maths (y-axis) score. Looking at data for many students allows us to build up a visualisation of the relationship between students' scores in maths and English.
Secondary research
Secondary research refers to new research undertaken using data previously collected by others. It has the benefit of being more cost-effective than primary research whilst still providing important insights into research questions under investigation.
Skewness
Skewness is the measure of how assymetrical the distribution of observations are on a variable. If the distribution has a more pronounced/longer tail at the upper end of the distribution (right-hand side), we say that the distribution is negatively skewed. If it is more pronounced/longer at the lower end (left-hand side), we say that it is positively skewed.
Statistical model
A statistical model is a mathematical representation of the relationship between variables.
Statistical software
Statistical software packages are specifically designed to carry out statistical analysis; these can either be open-source (e.g. R) or available through institutional or individual subscription (e.g. SPSS; Stata).
Structured metadata
Structured metadata define the relationship between data items/objects to enable computer systems to understand the contextual meaning of the data. It uses standardised content to facilitate the use of metadata for data discovery and sharing, and the relationship between metadata elements.
Study participants
Study participants are the individuals who are interviewed as part of a longitudinal study.
Survey logic
Also called conditional routing (sometimes called ‘filters’), survey logic refers to the flow that takes respondents through a survey. Respondents may be required to answer some questions only if they had provided a relevant response to a previous question. E.g. Only respondents who are currently at university may be asked to answer a question relating to their degree subject. This is important when considering missing data.
Survey weights
Survey weights can be used to adjust a survey sample so it is representative of the survey population as a whole. They may be used to reduce the impact of attrition on the sample, or to correct for certain groups being over-sampled.
Survival analysis
Survival analysis is an analytical technique that uses time-to-event data to statistically model the probability of experiencing an event by a given time point. For example, time to retirement, disease onset or length of periods of unemployment.
Sweep
The term used to refer to a round of data collection in a particular longitudinal study (for example, the age 7 sweep of the National Child Development Study refers to the data collection that took place in 1965 when the participants were aged 7). Note that the term wave often has the same meaning.
Target population
The population of people that the study team wants to research, and from which a sample will be drawn.
Time to event
Time to event refers to the duration of time (e.g. in hours, days, months, etc.) from a defined baseline to the time of occurrence of an event of interest (e.g. diagnosis of an illness, first re-offence following release from prison). Survival analysis can be used to analyse such data.
Tracing (or tracking)
Tracing (or tracking) describes the process by which study teams attempt to locate participants who have moved from the address at which they were last interviewed.
Unobserved heterogeneity
Unobserved heterogeneity is a term that describes the existence of unmeasured (unobserved) differences between study participants or samples that are associated with the (observed) variables of interest. The existence of unobserved variables means that statistical findings based on the observed data may be incorrect.
User guide
Part of the documentation that is usually provided with statistical datasets, user guides are an invaluable resource for researchers. The guides contain information about the study, including the sample, data collection procedures, and data processing. Use guides may also provide information about how to analyse the data, whether there are missing data due to survey logic, and advice on how to analyse the data such the application of survey weights.
Variables
Variables is the term that tends to be used to describe data items within a dataset. So, for example, a questionnaire might collect information about a participant’s job (its title, whether it involves any supervision, the type of organisation they work for and so on). This information would then be coded using a code-frame and the results made available in the dataset in the form of a variable about occupation. In data analysis variables can be described as ‘dependent’ and ‘independent’, with the dependent variable being a particular outcome of interest (for example, high attainment at school) and the independent variables being the variables that might have a bearing on this outcome (for example, parental education, gender and so on).
Vulnerable groups
Vulnerable groups refers to research participants who may be particularly susceptible to risk or harm as a result of the research process. Different groups might be considered vulnerable in different settings. The term can encompass children and minors, adults with learning difficulties, refugees, the elderly and infirm, economically disadvantaged people, or those in institutional care. Additional consideration and mitigation of potential risk is usually required before research is carried out with vulnerable groups.
Wave
The term used to refer to a round of data collection in a particular longitudinal study (for example, the age 7 wave of the National Child Development Study refers to the data collection that took place in 1965 when the participants were aged 7). Note that the term sweep often has the same meaning.